For Whom the Rate Tolls
Over the past 10 years Canadian debt holders haven't had much reason to fret about interest rates, but they may now. The Bank of Canada’s October 24, 2018 decision to raise the overnight rate by 25 basis points to 1.75 percent marks the fifth quarter-point increase since the summer of 2017. While higher rates are an indicator of a healthy economy, Canadians with mortgage and non-mortgage debt are starting to feel the pinch.
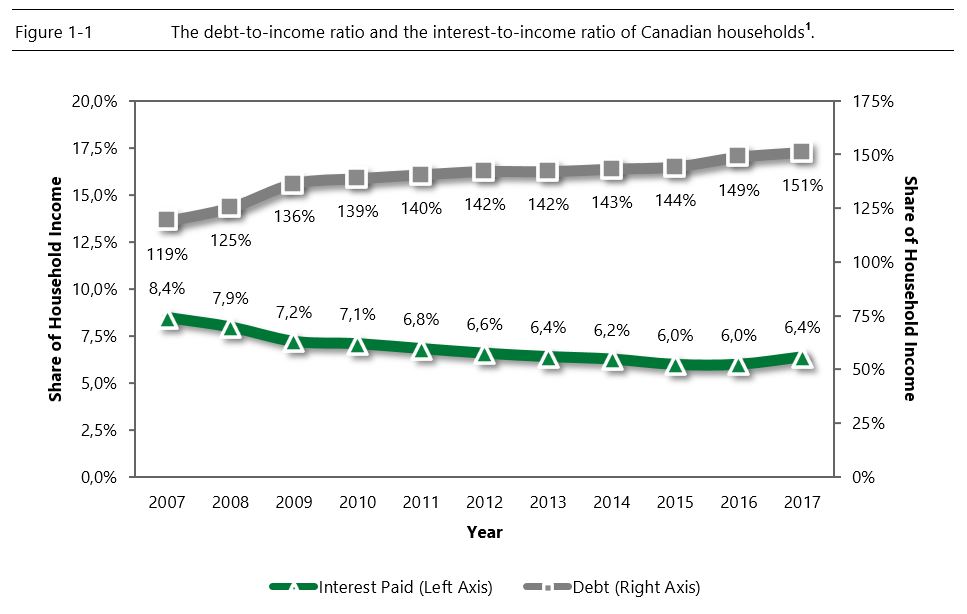
Until recently, higher rates haven’t been a big cause for concern. As Figure 1‑1 illustrates, while the debt-to-income ratio of Canadian households has been increasing since the start of the financial crisis of 2007 and 2008, the debt service ratio (the share of household income before tax used to finance said debt) has been easing. But that trend has been snapped with the debt service ratio starting to inch higher. The reversal of this trend will have multiple effects upon the economic behaviour of households, the first of which will be a squeeze on discretionary spending (household expenditure on non-essential items excluding shelter and food).
With the debt service ratio increasing to 6.4 percent in 2017 it is reasonable to expect this ratio will rise to approximately 7.2 percent by the end of 2018. While this is still lower than the debt service ratios observed prior to and immediately after the financial crisis, it will force Canadians to either decrease their saving (or debt repayment) rates, lower their discretionary spending or some combination thereof.
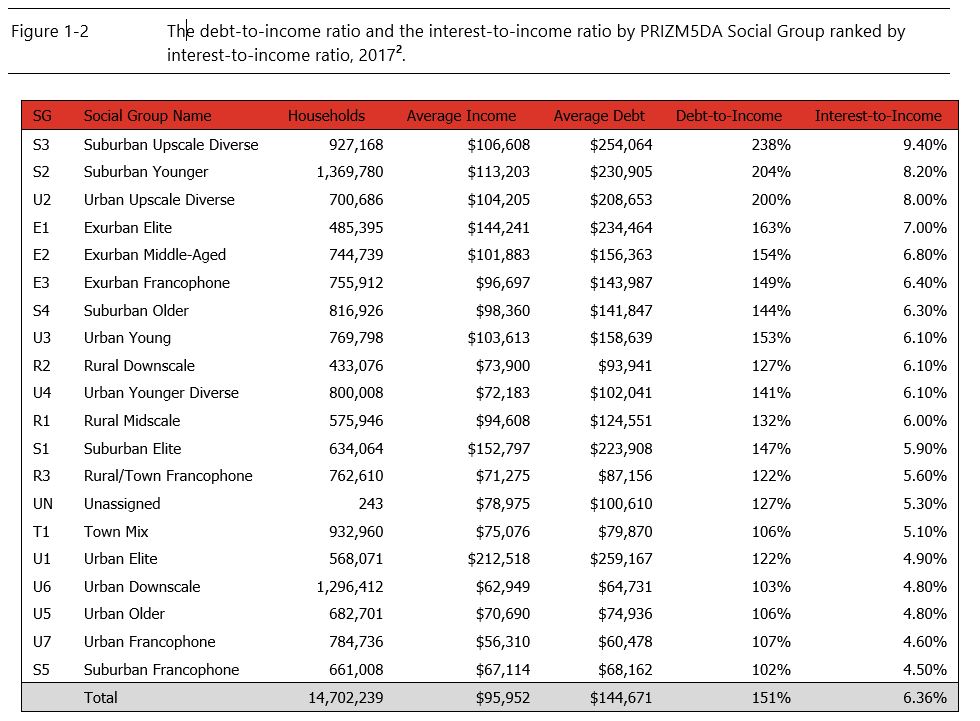
Clearly, certain segments of the Canadian population will be affected by higher rates more than others. Using WealthScapes 2018 at the PRIZM5 DA Social Group level (Figure 1‑2) we expect the mid-affluent suburban areas of Canada (the Suburban Upscale Diverse and Suburban Younger Social Groups) will be under the most pressure. These tend to be the areas of new development on the edge of major cities where we find the most first-time homebuyers and younger families. These younger families have not had time to build up their capital and will find their consumption and saving rates pinched, particularly by the increased interest payments on their higher mortgage balances.
At the other end of the spectrum, we find a mix of urban and francophone Social Groups. In the case of the urban Social Groups, we generally see lower levels of home ownership resulting in less mortgage debt and, hence, lower interest payments. The francophone Social Groups are also somewhat insulated from rising interest rates since households belonging to this segment tend to be concentrated in area that have experienced little real estate appreciation over the past decade, which means they haven’t added on significant amounts of mortgage debt.

What will higher rates mean for the average Canadian household?
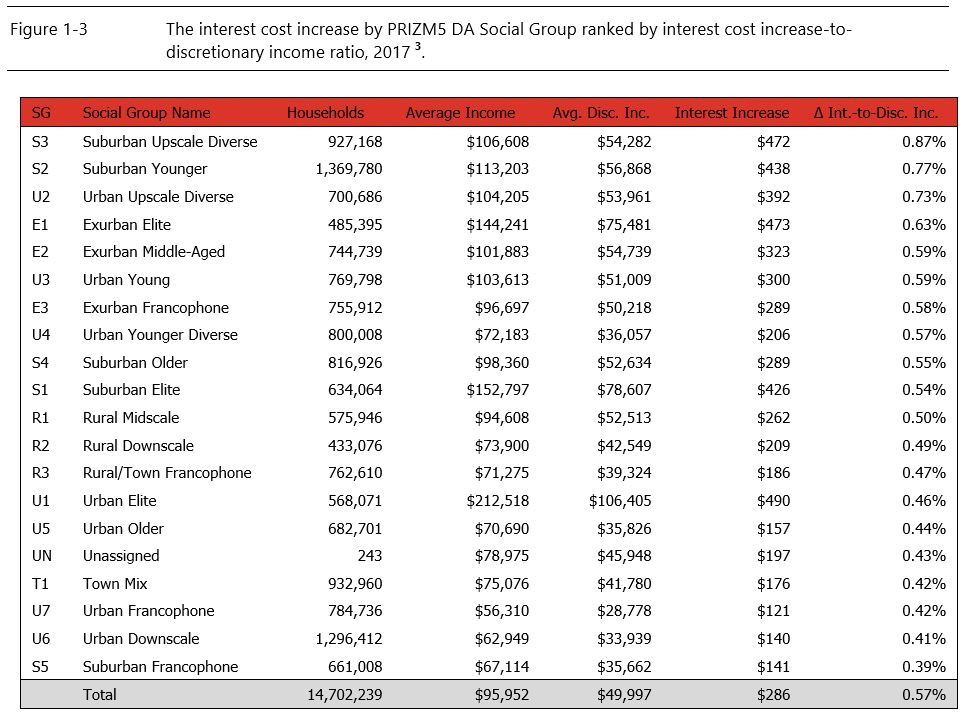
As a result of rising interest rates in 2017 Canadian households paid an additional $286 or 0.57 percent of their discretionary income (household income less personal taxes, shelter and food costs) on average in interest; however, this pain was most acutely felt by the Suburban Upscale Diverse and Suburban Younger social groups due to their higher debt to income ratios (Figure 1‑3).
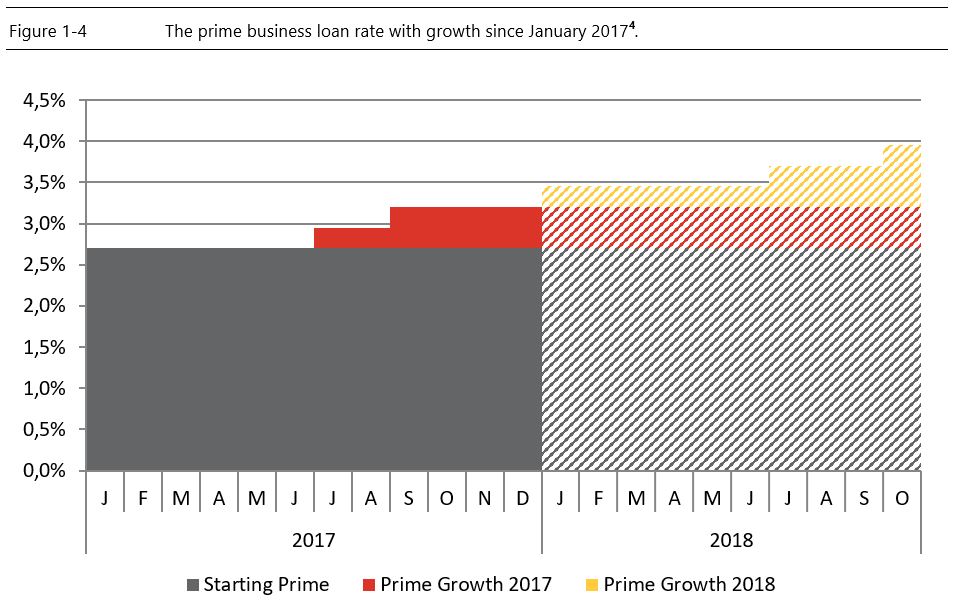
An additional $286 in interest payments for 2017 may not sound overly imposing, but that figure doesn’t account for the full effect of interest rate changes announced last year. The interest rate hikes occurred in the second half of 2017 (Figure 1‑4). The full year effect of the growth in the interest rates is actually 2.4 times higher than that already captured; for the year following the second interest rate hike, these two interest rate increases cost Canadian households an additional $686 per year in interest charges. Adding in the full year effects of interest rate hikes announced to date in 2018, the interest expense rises by about $1,715 annually per household (or roughly 3.4% of discretionary income) relative to their pre-July 2017 levels.
So far, the sting of higher rates has been largely limited to short-term debt and variable rate debt. It will take up to five years before the full effect of the interest rate hikes will be felt as fixed rate debt come to term and will have to reset at the higher rates. When this fixed-rate debt is added in, the true long-term effect of these interest rate hikes will be approximately $2,516 a year per household or 5.0 percent of discretionary income.
Therefore, even though the Suburban Younger households only observed their interest expenses rising by 0.77 percent relative to their end-of-year discretionary incomes, their financial plans should assume an interest expense increase of 4.6 percent relative to their discretionary incomes. This increase will slowly grow to about 6.8 percent relative to their discretionary incomes over the next five years. This assumes Canadian households will reduce their discretionary spending to pay their increased interest expenses; should these households opt to decrease their debt repayment rates (or take on even further debt) we would expect this expense to grow even further.
Is there any good news?
All of this does not necessarily suggest that Canadian discretionary expenditure is expected to decline as a result of higher interest rates. While the higher interest rates may eat into debtor discretionary spending, there are a large number of Canadian households who are dependent upon interest bearing assets and other fixed income assets who will benefit from higher interest rates.
It’s also worth noting that there is a strong correlation between debts and assets with age. While higher interest expenses may claw into the discretionary spending of the Millennial and the Generation X generations, higher interest income will boost Baby Boomer discretionary spending.
Additionally, even when fully factoring in the five interest rate increases observed so far, the debt service ratio is still only at pre-financial crisis levels; this is not uncharted territory. Finally, the interest rate increases are a result of the strong performance of the Canadian economy. With the current economy, the higher interest rate expenses should be more than offset by household income growth.
____________________________
Peter Miron is Senior Vice President, Research & Development at Environics Analytics and Isanna Biglands is a Research Associate at Environics Analytics
[1] Source: Bank of Canada, Statistics Canada, Environics Analytics calculations
[2] Source: Statistics Canada, WealthScapes 2018, Environics Analytics calculations
[3] Source: Statistics Canada, WealthScapes 2018, Environics Analytics calculations
[4] Source: Bank of Canada, Environics Analytics calculations


